Summary: Genworth Financial (GNW)
- In our previous piece we focused on signs of liquidity issues at China Oceanwide including spiking debt levels, negative operating performance, and the aggressive pledging of equity in its subsidiaries.
- Today we share a deeper-dive into Oceanwide’s operations, including an overview of its leverage-fueled trophy asset development spree which has shown recent signs of stalling.
- We have also identified accounting red flags, including Oceanwide’s booking $11.4 billion of “development costs” as a current asset, as well as $4.8 billion in questionable related-party receivables.
- Bloomberg recently reported that a key Oceanwide operating subsidiary was “scrambling to sell assets to repay debt.” With another $1.6b of bond maturities due in Q1’19 we expect significant near-term instability and ultimately expect the conglomerate to unravel within 24 months.
- Given its liquidity issues we do not think China Oceanwide will fulfill its commitments to Genworth & its policyholders and reiterate our view that this deal looks starkly at odds with the interests of policyholders.
Overview
In our previous piece we highlighted signs of liquidity issues at Genworth’s emergent acquirer, China Oceanwide (“Oceanwide”). In particular we focused on Oceanwide’s (i) consistently negative operating & investing cash flow (ii) spiking debt levels; and (iii) the aggressive pledging of equity in Oceanwide’s public subsidiaries, which have all steadily declined in value.
Today we are sharing a deeper-dive into Oceanwide’s operations, including an overview of the conglomerate’s leverage-fueled trophy asset development spree, which has recently shown signs of stalling.
We have also taken a closer look at Oceanwide’s audited financials, identifying red flags with its working capital balances including (i) the reporting of $11.4 billion of “development costs” as a current asset; and (ii) the reporting of $4.8 billion in questionable related-party receivables as a current asset. Finally, we review Oceanwide’s debt maturities, with a particular focus on a large $1.6 billion slate of bonds due in Q1 ’19, just after the hoped-for Genworth deal closing.
Collectively this analysis bolsters our view that Oceanwide is overleveraged and facing a severe and current liquidity crunch. The nearly unlimited access to credit the conglomerate has enjoyed historically has recently tightened.
If the Genworth deal were to close we believe it would buy Oceanwide some additional time, but we do not see it materially altering Oceanwide’s collision course. We predict that China Oceanwide will collapse within 24 months barring a financial miracle.
Background
The key question facing regulators right now is whether the Oceanwide deal will leave Genworth’s policyholders better or worse off.
The consensus seems to be that Genworth is a financially weak holding company. Many have taken the view that if Oceanwide can contribute some cash to Genworth’s insurance carriers then it would be better than nothing.
We think that view is misguided, and that the opaque Chinese conglomerate is not coming to the rescue. On the contrary, given the financial state of Oceanwide we expect the opposite will take place.
The current deal proposal relies on Oceanwide largely contributing capital to Genworth after the deal closes. Similarly, Genworth is slated to contribute capital to its primary insurance carrier, GLIC, after the deal closes. We expect these IOU’s will never materialize. Instead, we think Oceanwide is more likely to contribute a token amount up-front then seek any available means of extracting capital out of Genworth in an effort to stay solvent while policyholders are imperiled in the cross-border fallout.
Background: China Oceanwide’s Negative Operating Performance Coupled With Spiking Debt Levels Creates a Toxic Combination
As noted in our previous piece, Oceanwide’s operating performance has been consistently negative with a recent sharp deterioration:

Sources: 2016-2017 audit [pg 14], 2015 audit [pg 10], 2014 audit [pg 9], 2013 audit [pg 9]
Meanwhile, the conglomerate has fueled its expansion with an ever-increasing debt burden:
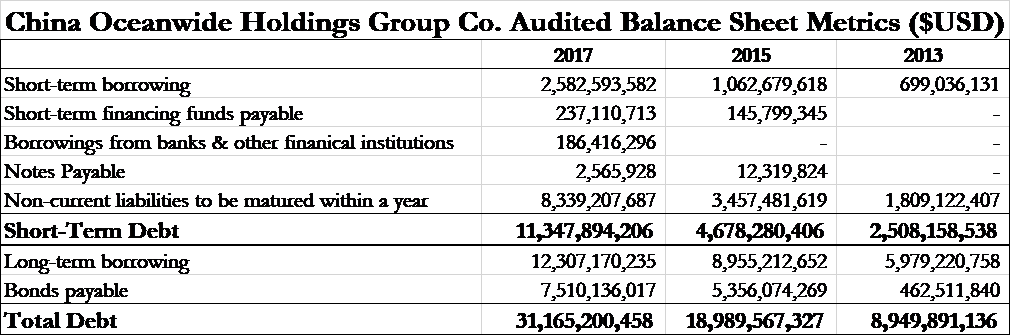
*Note: non-current liabilities to be matured within a year include long-term borrowings and payables due within 1 year (pg. 90)
Working Capital Red Flag: Current Assets Include Over $11.4 Billion of Real Estate Development Costs
Given the lack of operating cash flows and the rising debt levels, the key question becomes “how long can we keep the lights on?”
For this we turn to Oceanwide’s working capital balances (i.e.: current assets minus current liabilities). As of 2017 year-end the conglomerate had working capital of over $10 billion, suggesting ample liquidity to meet its obligations, at first glance.
When taking a closer look however we notice that by far the largest current asset is inventory:
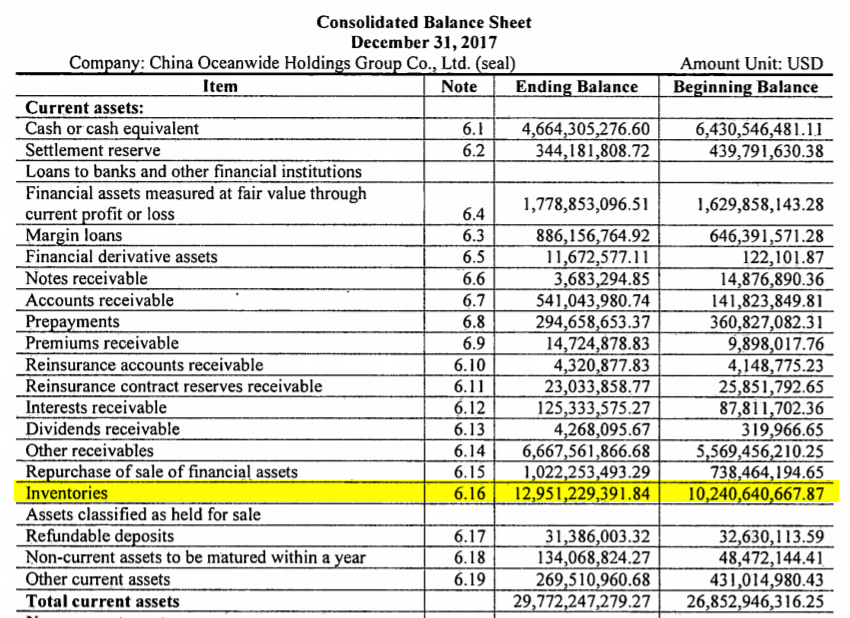
By recording almost $13 billion in inventory as a “current” asset the implication is that the balance can be converted into cash within a year or less.
This seems starkly at odds with reality. The entire conglomerate only generated $3.4 billion in revenue as of the same 2017 year-end and has never generated more than ~$4 billion in revenue in any year. Furthermore, we see that inventory has been steadily climbing every single year, regardless of revenue growth or decline:

Source: 2016-2017 audit [pg 13], 2015 audit [pg 9], 2014 audit [pg 8], 2013 audit [pg 8]
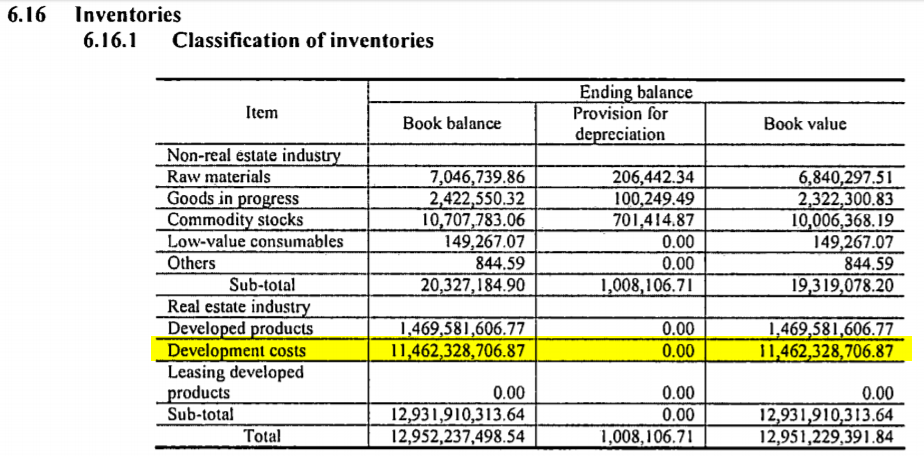
The audit footnotes (pg. 72) show that ~99.8% of the inventory is real estate related. But rather than consisting largely of completed buildings, $11.4 billion (or 88.5% of the total inventory balance) is recorded as “development costs”:
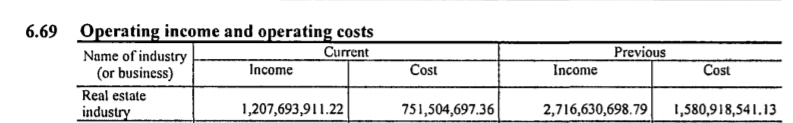
For context, Oceanwide’s total real estate revenue was only $1.2 billion in 2017 (pg. 82), suggesting that development costs alone represent about 9.5 years worth of inventory:
The unusually large development cost balance raises multiple questions:
- Why is Oceanwide carrying so many development costs as “current” assets? As noted earlier, the balance has just grown over time regardless of sales movements. It seems that for the past five years very little of its real estate projects have been sold or converted into rental units, yet they continue to be carried as “current”.
- Just how many properties are there that have yet to be completed, and what are they?
The above casts serious doubts about the credibility of “development costs” as a working capital asset. It may also cast doubt on the credibility of the reported number in general. At the very least, it raises questions about how Oceanwide is deploying its resources.
Note that if development costs were excluded from working capital the conglomerate would be in a negative working capital position:

Negative working capital is a sign that a business could have trouble paying its existing debts when due and payable. In Oceanwide’s case, it has to pay these debts and then fund the $2.7 billion acquisition of Genworth along with its subsequent funding commitment to Genworth and its insurance carriers.
Oh The Joys Of Leverage: China Oceanwide’s Trophy Asset Development Spree
After identifying Oceanwide’s extensive development cost balances we sought to learn more about its property endeavors. We learned through media reports and subsidiary filings that the conglomerate has been developing multiple large “trophy” assets.
Putting aside the wisdom of pursuing these splashy projects, the size and number of these simultaneous developments tells us that substantial new capital will be needed to see them through to completion.
The projects below (together with those in the following section) collectively account for only about $2.6 billion in known deployed costs (pg. 14, pg 16 & pg 1), suggesting that another $8.8 billion in unfinished “development costs” could exist in other parts of the world. (Note that the China Oceanwide website lists some local developments but the website appears to be outdated.)
San Francisco Office Skyscraper (Scheduled to Be Completed in 2021)
Oceanwide is in the process of building the second largest office tower in San Francisco, a 905 ft. skyscraper in the heart of the city. The building complex is to include 2 million square feet of mixed-use office and residential space.
The company had purchased the site for $300 million from private equity investors that had paid only $113 million for it two years earlier. BizJournals recently reported that the development is the most expensive construction project in all of San Francisco, with construction costs expected to be in the $1.6 billion range. Oceanwide began construction near 2016 year-end, with construction slated to be completed in 2021.
Los Angeles Luxury Highrise (Scheduled to Be Completed in 2020)
In Los Angeles, Oceanwide has embarked on a $1 billion development to build the three tallest residential buildings in the city’s skyline. The luxury projects are slated to be completed in 2020.
Indonesian Power Plants (Completion Date Unknown)
In 2015, Oceanwide’s operating subsidiary acquired a project to develop a pair of power plants in Indonesia (pg. 18). The projects were anticipated to be grid-connected by the end of 2017. Development was delayed due to litigation (which was subsequently resolved in February of this year.) To date, the company has invested $362 million into the projects. (pg. 18)
Oh The Pitfalls of Leverage. Bloomberg: Oceanwide’s Operating Subsidiary “Scrambling to sell assets to repay debt”
In September, a Bloomberg article on Chinese junk bond sales noted that the Oceanwide subsidiary responsible for many of the trophy-asset developments was “scrambling to sell assets to repay debt.” The entity is the developer for the Los Angeles and Indonesian endeavors mentioned above.
Additionally, the entity is responsible for the projects below, which appear to have stalled without formal explanation:
A Planned 1,400 Foot New York City “Supertall” Looks To Have Super-Stalled
In 2015 Oceanwide paid $390 million to purchase two sites in New York’s South Street Seaport, with plans to construct a 1,400 foot “supertall” tower on the location.
The Real Deal reported that the company filed demolition plans for the sites in early 2017, but as of April 2018 no building plans had been filed with the city’s Department of Buildings. The publication referred to the situation as a “mystery”.
Luxury Resort In Hawaii’s Oahu
In 2015-2016 Oceanwide spent a total of about $614 million on land purchases in Hawaii (pg. 16-17) in order to build an ultra-luxurious hotel under the Atlantis brand along with two other hotels, residential condos, and commercial space.
The projects look to have stalled. In mid-June of this year it was reported that the projects are still in the “early design and planning process” with the sites sitting idle.

Overall
Each of these construction projects have costs to complete that are not fully disclosed in the financial statements and could amount to billions of dollars in additional financial commitments. So, Oceanwide will need funds to address its working capital needs (which includes $11.4 billion in questionable “development costs”), its $2.7 billion Genworth acquisition, and an unknown amount to fund these and other construction projects that are currently in various stages of development and pre-development.
After all this, what is left for the Genworth policyholders?
Working Capital Red Flag: Current Assets Include $4.8 Billion In Receivables Owed By Related Parties
Turning back to the financials, we see other working capital red flags aside from unusually large inventory levels and apparently stalled development projects.
The second largest current asset item is $6.6 billion in “other receivables”:
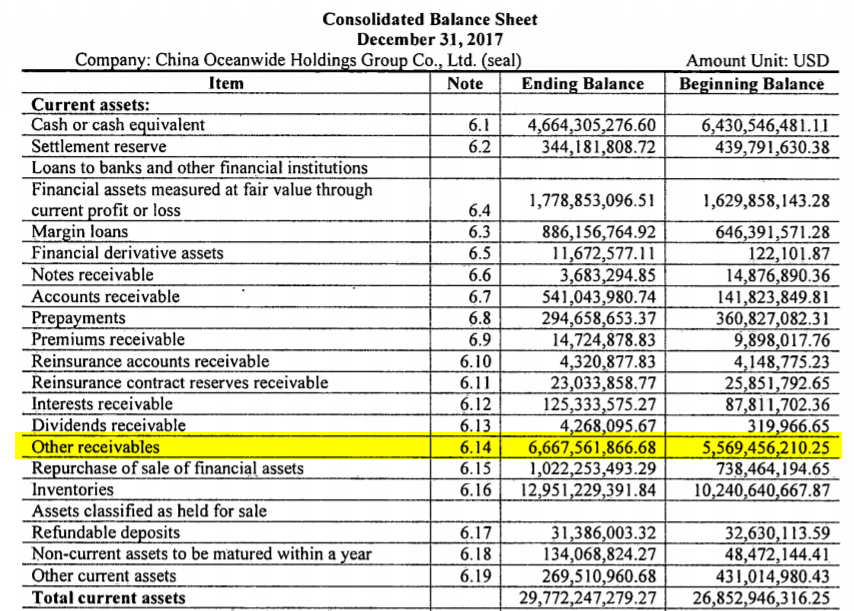
This item struck us as odd because of its size relative to the operating performance of the conglomerate (it’s almost twice as large as total 2017 revenue). Additionally, “other receivables” ballooned by almost $1.1 billion from 2016 to 2017 despite a year over year revenue decline.
When looking closer at the footnotes we see that these other receivables are owed by a small number of entities (pg. 71):
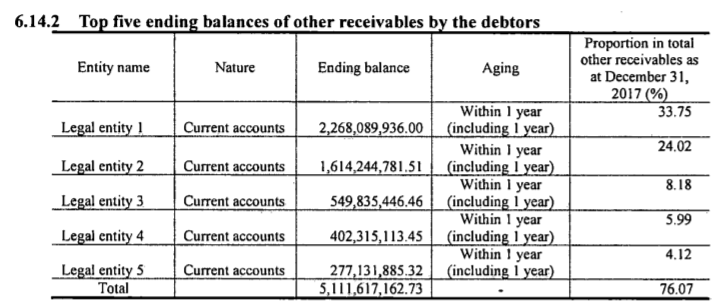
We see later in the filings that the precise amounts owed by the top 4 redacted legal entities in the above figure 6.14.2 correspond to another footnote detailing receivables from related parties (pgs 112-113):
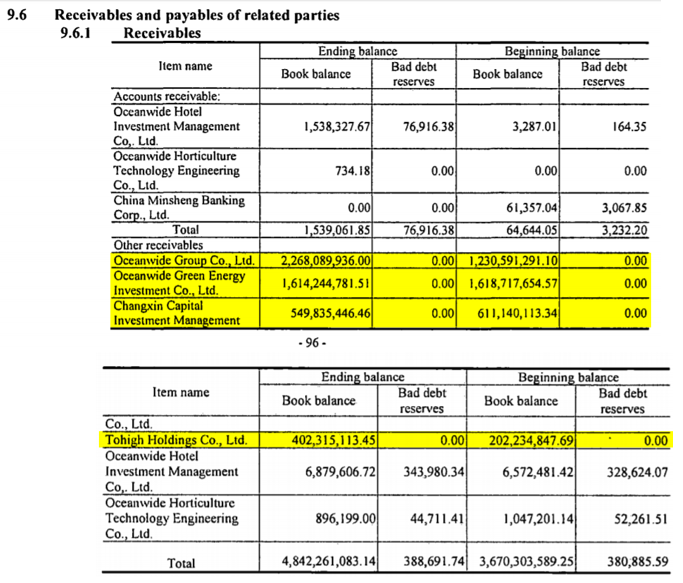
Thus we can surmise that at least $4.8 billion of “other receivables” is owed by related party entities. Much of these were up-streamed to Chairman Lu’s other entities.
It is difficult for us to imagine that these receivables have resulted from an exchange of goods or services. In 2015, for example, the “other receivables” account grew by more than the conglomerate’s total revenue:

Source: 2016-2017 audit [pg 11,13], 2015 audit [pg 8-9], 2014 audit [pg 6,8], 2013 audit [pg 6,8]
Instead, it looks like “other receivables” is simply a mechanism to make unsecured loans to Chairman Lu’s other entities.
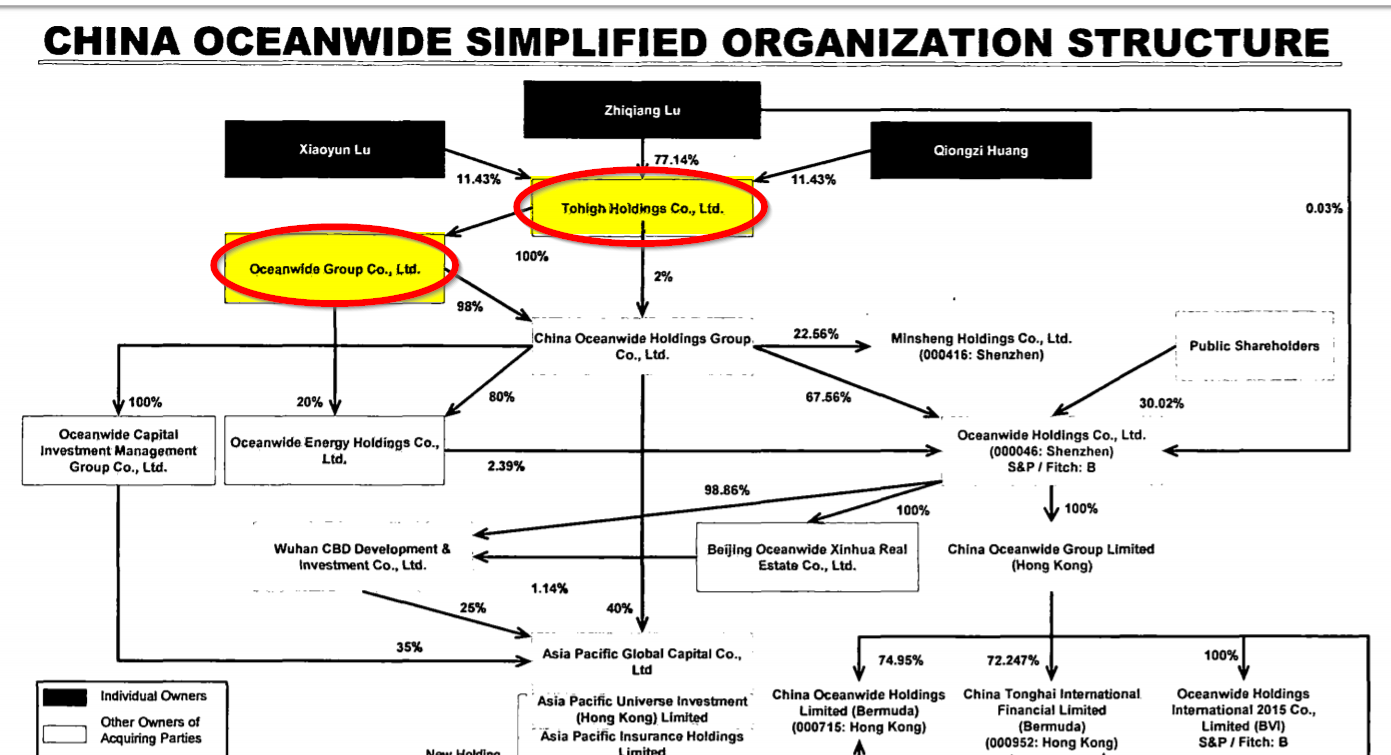
In particular, almost $2.7 billion is owed by entities that look to essentially be the Chairman’s holding companies. The conglomerate’s org chart (pg. 4) shows that Tohigh Holdings is the Chairman’s key holding company, while Oceanwide Group Co. Ltd owns stakes in Oceanwide Energy and China Oceanwide:
This poses several important questions:
- What is the credit worthiness of these receivables? If almost $2.7 billion is owed from related entities with limited operations of their own what is their capacity to actually pay the money back?
- Why is Oceanwide functioning as a de facto bank for these entities? Do these related entities lack the credit worthiness to get their own financing?
- What are the terms of these receivables? Are these interest-bearing or are they simply unsecured, interest-free loans to the Chairman’s entities?
- Why have these receivables steadily grown over time rather than been paid off?
To answer some of these questions we may wish to explore Chairman Lu’s personal spending habits.
“Three Giant Mansions” and a Winery
Far be it for us to judge how a wealthy person spends their money, but Chairman Lu has largely been spending borrowed cash. As the WSJ reported in 2015:
Since 2012, Mr. Lu has purchased three giant mansions in Atherton (California), paying $21 million, $25 million and $30 million, respectively… Collectively, the three properties have 19 bedrooms and 22 bathrooms, according to property-sales listings…
…last spring, Mr. Lu tried to buy an even pricier home, offering $41 million to buy the former home of Jim Clark, co-founder of Netscape, according to court records and a person familiar with the matter.
…(Oceanwide) also paid $41 million for a ranch in Sonoma County that can hold a winery.
These are only the assets we were able to identify via domestic media outlets. It is unclear how many mansions and other creature comforts Mr. Lu has accumulated globally at this point.
We wonder, why is the Chairman purchasing so many foreign mansions clustered in the same California town? It begs the question of whether these are merely attempts to shift assets overseas. At best it does not paint a portrait of a staid, judicious asset manager. Instead, such spending is more reminiscent of the teenager who managed to get a hold of a parent’s credit card.
Working Capital Item #3: Declining Cash Balances And Restricted Cash
Moving right along, Oceanwide’s third largest current account asset after “development costs” and related-party receivables is cash and equivalents. The balance has declined over the past several years but stood at $4.6 billion as of end of 2017:

In the footnotes (pg. 62) we see that about 26% of this balance, or $1.2 billion is restricted, largely due to pledges for loans, bonds, and other deposits:

Thus, net of restricted cash the conglomerate had about $3.4 billion in unrestricted cash with which to meet its obligations at the end of 2017. Given the trend of negative operating cash flow, a high current debt burden, and the aggressive development slate we can only guess what the 2018 year-end cash balance will look like.
China Oceanwide Has $1.6 Billion In Bonds Coming Due Q1 ’19. Right Before The Hoped-For Genworth Deal Closing
In our earlier piece we noted that Oceanwide’s corporate structure looked levered to the hilt. The S&P maintains a CCC+ rating with a negative outlook on the conglomerate’s key operating entity, Oceanwide Holdings Co. Ltd.:

In S&P’s recent ratings release they noted that the entity’s capital structure was “unsustainable” and stated:
We expect Oceanwide to continue to face substantial refinancing pressure, and believe the prospect of meaningful deleveraging is still remote. This is due to the company’s very high short-term debt and its overall huge debt burden.
In another S&P release dated November 6th, 2018 titled “Cycle Turning Adds Risks For China’s Weakest Developers”:
After robust activity for more than two years, the momentum waned in September and October, traditionally prime months for Chinese property.
…A downturn for such a cyclical sector has been widely anticipated, but the timing is particularly bad since credit conditions aren’t conducive either.
…The financing landscape is the most unfavorable in years–whether it’s a clampdown on alternative financing, domestic bonds being designated only for refinancing, or a surge in offshore bond yields. Moreover, many developers have large refinancing needs due to surging maturities or exercisable puts on onshore bonds. Smaller developers will certainly have to endure higher coupons. In some cases, depleted investor demand will also make new issuances altogether unfeasible.
…Most rated developers are actually likely to increase market share by picking up assets from more-stressed peers, while the weakest face a real possibility of collapsing.
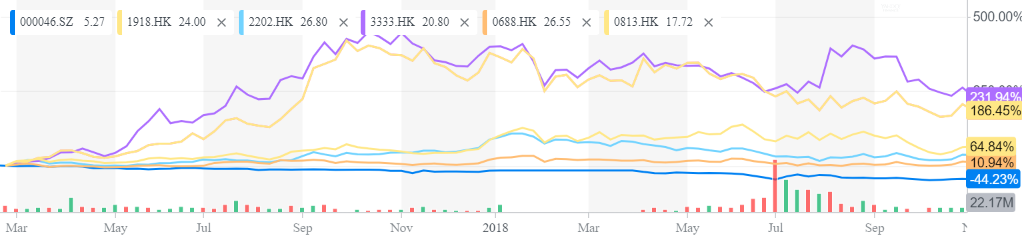
In case there is any doubt about whether Oceanwide is among the strong or the weak developers, here is the 2-year price chart of Oceanwide Holdings relative to the 5 major Chinese property developers (Oceanwide is the one at the bottom with -44.23% performance over the period):
Following those findings, we reviewed the bond maturity schedule from parent China Oceanwide’s 2017 audit (pg. 93). We learn two key takeaways from an analysis of this data set:
- The conglomerate has relied on short-term debt to fuel its expansion. The duration of Oceanwide’s $7.5 billion in bonds is only ~3.6 years.
- The Genworth deal’s targeted closing (Q4 of this year) comes right before a slew of $1.6 billion in bonds come due in Q1 ’19.
In addition to the scheduled Q1 ’19 bond maturities, Oceanwide has recently rolled debt by issuing new short-term obligations. The S&P release noted that Oceanwide repaid offshore senior notes and domestic corporate bonds this year by obtaining an RMB 11.6 billion (US$ 1.6 billion) one-year loan facility and by seeking support from parent China Oceanwide.
The upcoming Q1 ’19 bond payments look to present a daunting hurdle given the conglomerate’s recent struggles to juggle multiple debt repayments and other financial commitments. The conglomerate faces about $3 billion in new bond maturities for ‘19, not counting any additional debt rollovers or short-term liabilities that may have been pushed-off from this year.
Conclusion: This Ocean is Running Dry
Oceanwide will need funds to support (i) its working capital balance (which includes at least $16.2 billion in questionable “development costs” and related-party receivables); (ii) billions in construction projects that are currently in various stages of development and pre-development; (iii) its looming multi-billion bond payments; and (iv) the $2.7 billion proposed Genworth acquisition. This is all in the face of negative historical operating cash flow and tightening credit markets.
After all this, will Oceanwide be able to make good on its promises to contribute $1.5 billion to Genworth “over time following consummation of the merger”? In our view, that is the key question underpinning this proposed transaction. We think the answer is a clear ‘no’.
We hope the regulators take the signs of financial distress at Oceanwide into consideration as they weigh the decision for Genworth’s policyholders. We reiterate our view that this deal looks to be starkly at odds with the best interests of policyholders.
Disclosure: I am/we are short GNW.
I wrote this article myself, and it expresses my own opinions. I am not receiving compensation for it. I have no business relationship with any company whose stock is mentioned in this article.
Additional disclosure: Use of Hindenburg Research’s research is at your own risk. In no event should Hindenburg Research or any affiliated party be liable for any direct or indirect trading losses caused by any information in this report. You further agree to do your own research and due diligence, consult your own financial, legal, and tax advisors before making any investment decision with respect to transacting in any securities covered herein. You should assume that as of the publication date of any short-biased report or letter, Hindenburg Research (possibly along with or through our members, partners, affiliates, employees, and/or consultants) along with our clients and/or investors has a short position in all stocks (and/or options of the stock) covered herein, and therefore stands to realize significant gains in the event that the price of any stock covered herein declines. Following publication of any report or letter, we intend to continue transacting in the securities covered herein, and we may be long, short, or neutral at any time hereafter regardless of our initial recommendation, conclusions, or opinions. This is not an offer to sell or a solicitation of an offer to buy any security, nor shall any security be offered or sold to any person, in any jurisdiction in which such offer would be unlawful under the securities laws of such jurisdiction. Hindenburg Research is not registered as an investment advisor in the United States or have similar registration in any other jurisdiction. To the best of our ability and belief, all information contained herein is accurate and reliable, and has been obtained from public sources we believe to be accurate and reliable, and who are not insiders or connected persons of the stock covered herein or who may otherwise owe any fiduciary duty or duty of confidentiality to the issuer. However, such information is presented “as is,” without warranty of any kind – whether express or implied. Hindenburg Research makes no representation, express or implied, as to the accuracy, timeliness, or completeness of any such information or with regard to the results to be obtained from its use. All expressions of opinion are subject to change without notice, and Hindenburg Research does not undertake to update or supplement this report or any of the information contained herein. Hindenburg Research and the terms, logos and marks included on this report are proprietary materials. Copyright in the pages and in the screens of this report, and in the information and material therein, is proprietary material owned by Hindenburg Research unless otherwise indicated. Unless otherwise noted, all information provided in this report is subject to copyright and trademark laws. Logos and marks contained in links to third party sites belong to their respective owners. All users may not reproduce, modify, copy, alter in any way, distribute, sell, resell, transmit, transfer, license, assign or publish such information.